Building data centers in 2026 is more expensive than ever. The average cost per megawatt (MW) has jumped to $11.3M globally, with AI-optimized facilities costing $15M–$20M+ per MW. U.S. construction spending reached $85.3 billion, nearly doubling since 2024. Rising material costs, labor shortages, and advanced cooling systems are key cost drivers. Owners must plan for regional cost variations (up to 40%) and long equipment lead times to avoid delays and budget overruns.
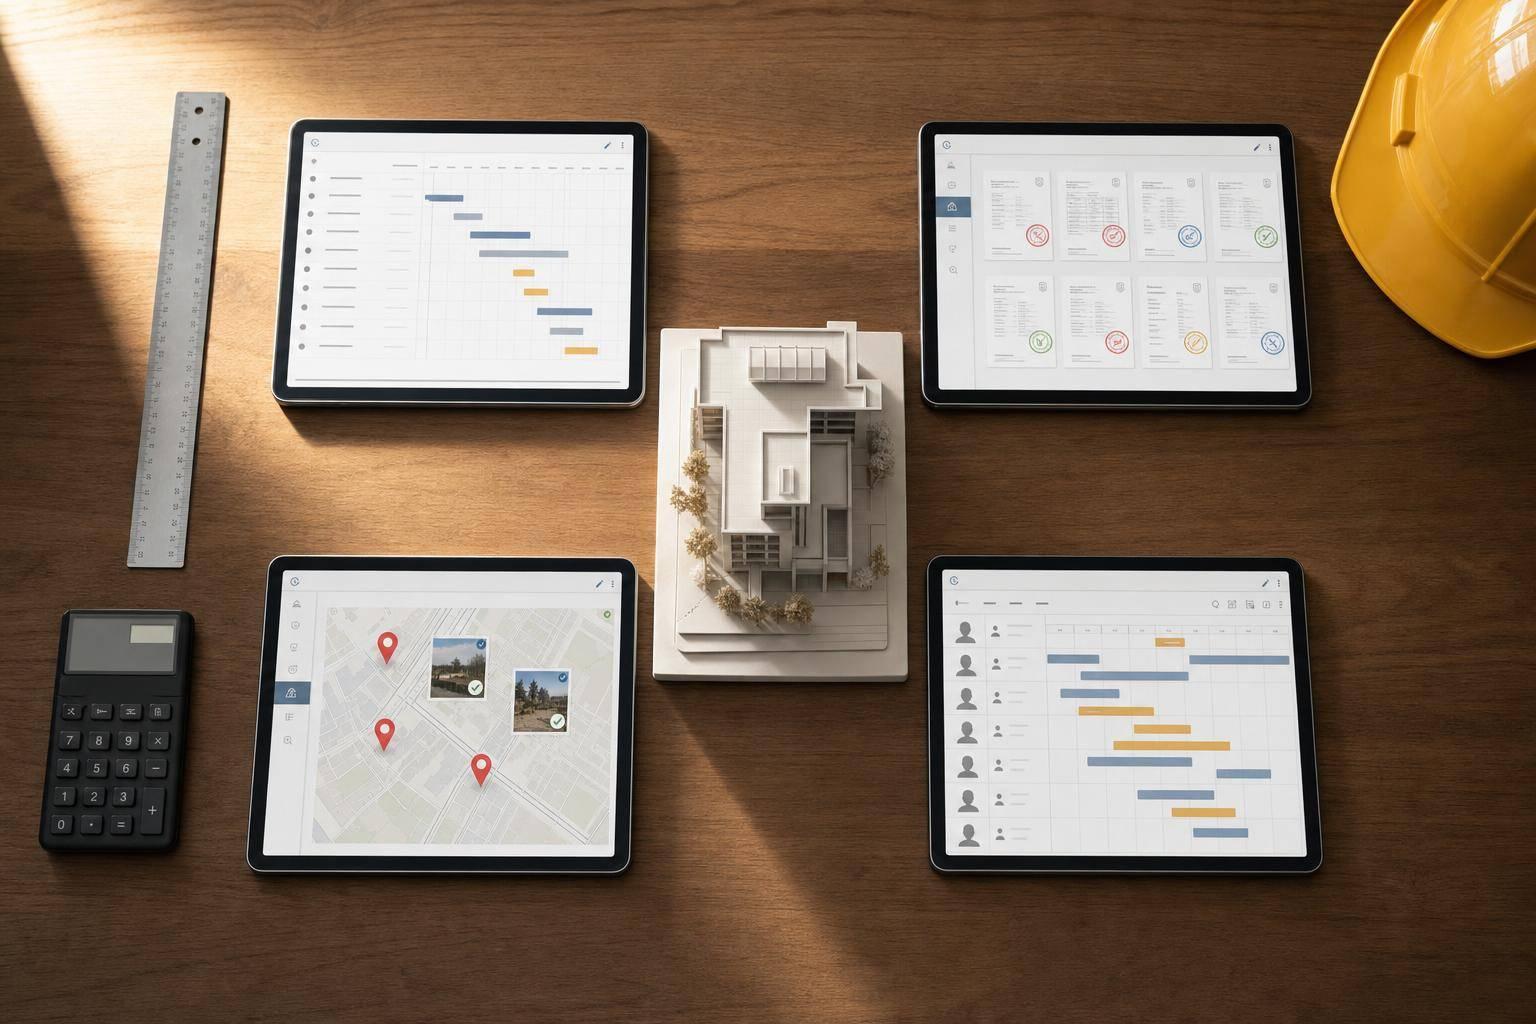
Pro Tips: Start procurement early (18–22 months), consider modular designs, and hire experienced teams to manage MEP systems and commissioning. For more insights, keep reading.

Data Center Construction Cost Per MW by Facility Type (2026)
Benchmarking is a quick way to check if your budget aligns with current trends. Between 2025 and 2026, data center construction costs surged from $630 to $960 per square foot [1]. With such a sharp increase, relying on older estimates can lead to inaccuracies.
For a detailed look at planning for 2026, refer to the data center construction guide.
Here’s a breakdown of current U.S. construction costs for the four main types of data center facilities. These figures cover core construction elements like electrical and mechanical systems, structural components, and fit-out. They exclude costs for land, IT equipment, and permitting.
| Facility Type | Cost Per Square Foot | Cost Per MW |
|---|---|---|
| Enterprise / Tier II | $600 – $750 | $8M – $10M |
| Colocation / Tier III | $750 – $950 | $10M – $12M |
| Hyperscale / Tier IV | $950 – $1,100+ | $12M – $15M |
| AI-Optimized | $1,100 – $1,500+ | $15M – $20M+ |
Standard shell-and-core facilities typically average around $11.3 million per MW [6]. For AI-optimized campuses at the gigawatt scale, total costs can range from $45 billion to $55 billion per GW [6].
AI-optimized centers are 50% to 100% more expensive per square foot than traditional data centers. This is due to the need for advanced liquid cooling systems and higher rack densities of 30–50+ kW per rack, compared to the 5–10 kW standard in conventional builds [1][6]. Additionally, moving up the Uptime Institute Tier classifications adds 15% to 25% to overall construction costs [1]. These details highlight how design choices directly impact budgets.
Understanding the relationship between these two metrics is essential for precise budgeting.
Relying on just one metric can lead to costly mistakes. Two facilities with the same square footage can have very different MW loads and, consequently, very different costs. Per-MW costs tie spending to operational capacity, while per-square-foot costs are tied to the physical footprint.
"Square-foot pricing alone can mislead because an AI-ready hall and a low-density enterprise hall can share similar footprints while carrying very different MW capabilities." - Element Homes [6]
To convert between the two metrics, follow these steps:
For example, a 20 MW colocation facility at $11M per MW with a 200,000 sq. ft. footprint calculates to about $1,100 per square foot. This is above the national average for that tier, indicating either a high-density design or a smaller-than-average floor plan. Adjusting either the footprint or MW target immediately changes the per-square-foot figure, making it crucial to balance both metrics during planning.
Benchmarks represent median outcomes, not ideal scenarios. The lower end of any range is typically seen in areas with favorable labor markets, owner-furnished equipment (OFE) strategies (e.g., hyperscalers purchasing switchgear and generators directly), or modular design efficiencies [3]. First-time builders or those in constrained markets often end up in the mid-to-upper range.
Two common budget mistakes to avoid:
"The jump from $7M/MW in 2020 to $11M–$20M/MW in 2026 isn't one cost driver. It's four: electrical density, liquid cooling, redundant power trains, and scripted functional testing." - Archdesk [3]
Understanding where your money is going is crucial when planning a data center. Unlike commercial buildings, data center construction has a completely different cost structure, and the differences can be surprising for first-time owners.
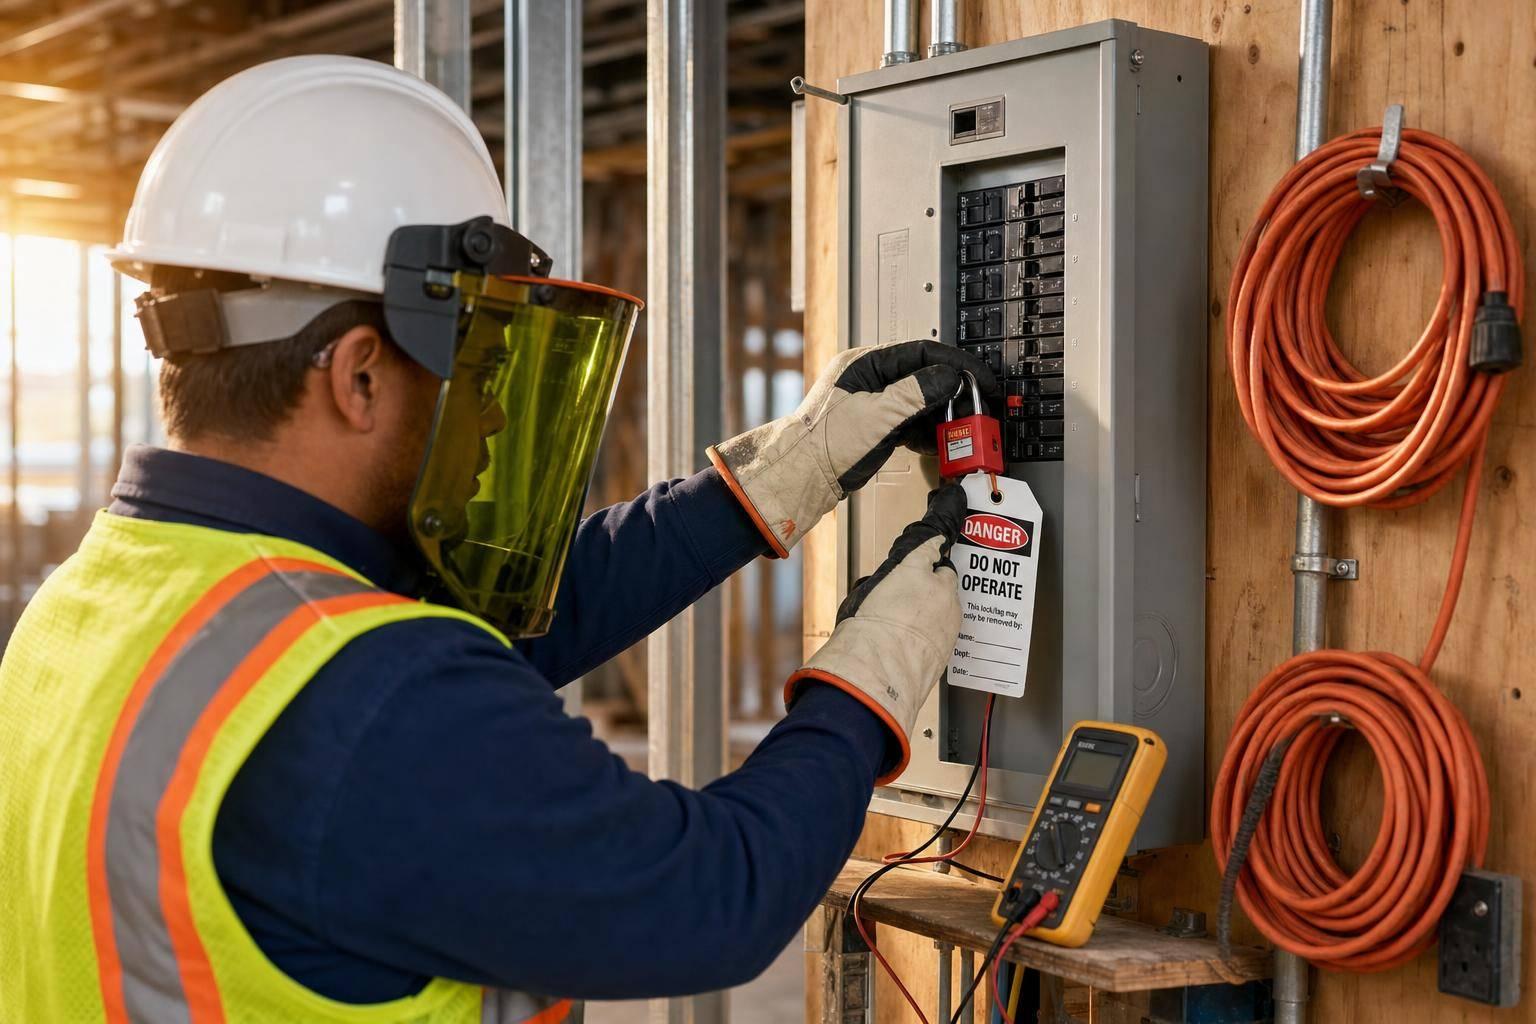
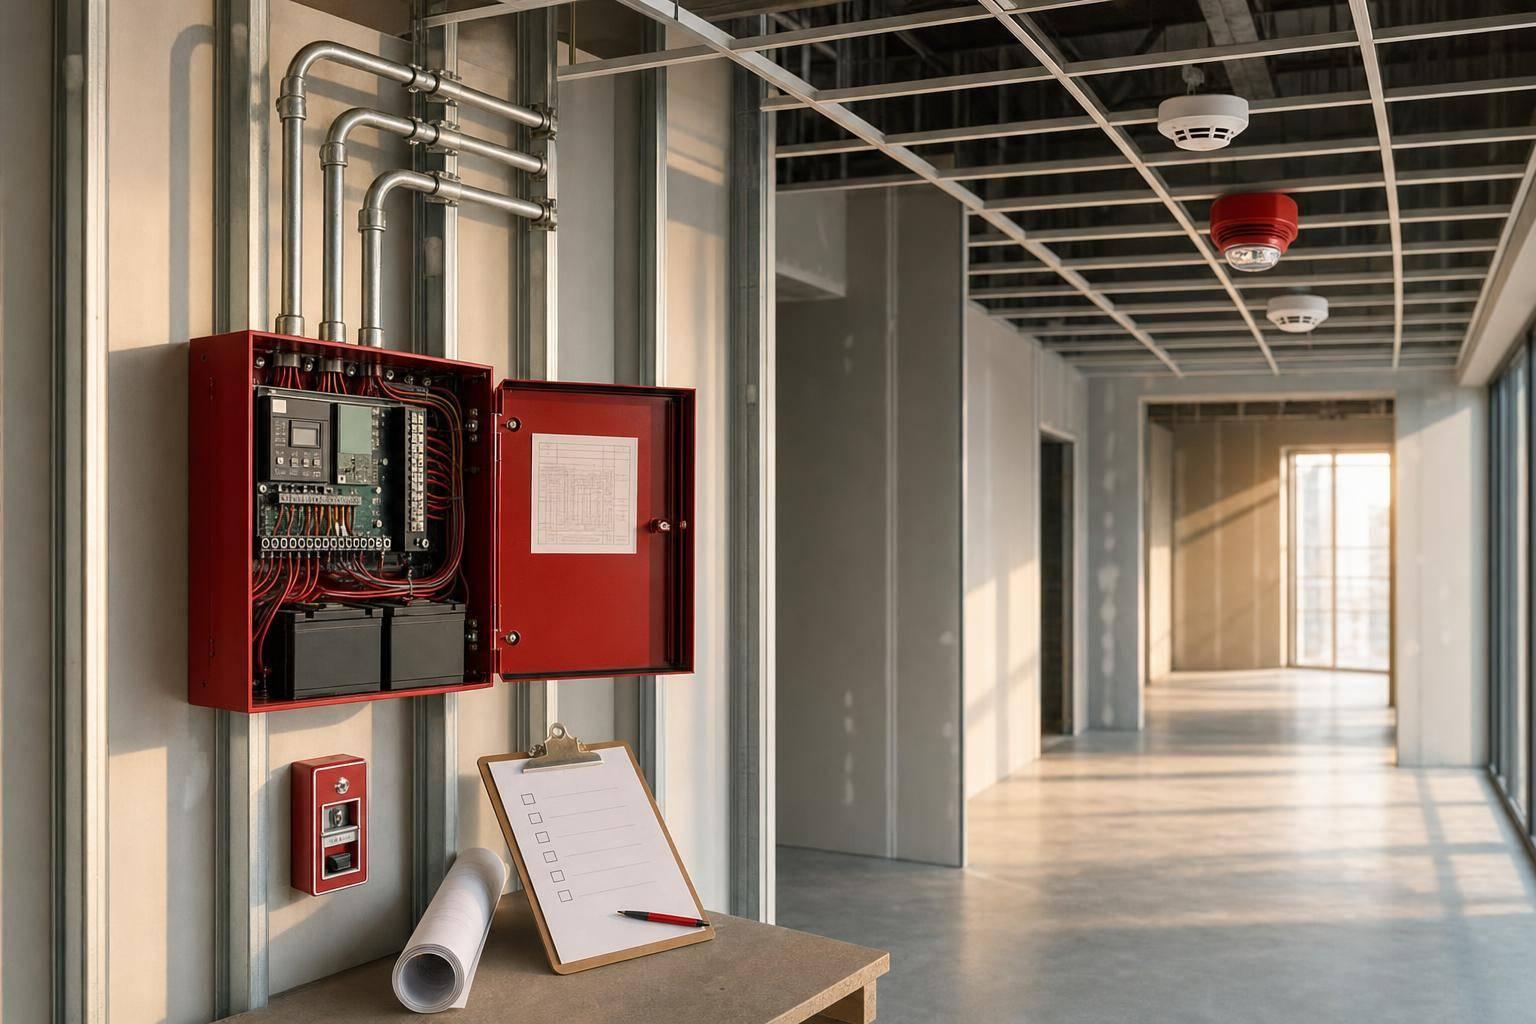
If you're new to building data centers, you might be shocked to learn that the physical structure is just a small slice of the budget. The biggest expense is electrical and power infrastructure, which eats up 40–45% of the total construction costs. This includes utility interconnection, switchgear, UPS systems, generators, and power distribution units [1]. Comparatively, the building shell only accounts for about 10–15% of the budget.
For a closer look at how these systems fit into the construction process, check out the data center construction guide.
Here’s a breakdown of typical cost distribution:
| Component | % of Total Cost |
|---|---|
| Electrical & Power | 40–45% |
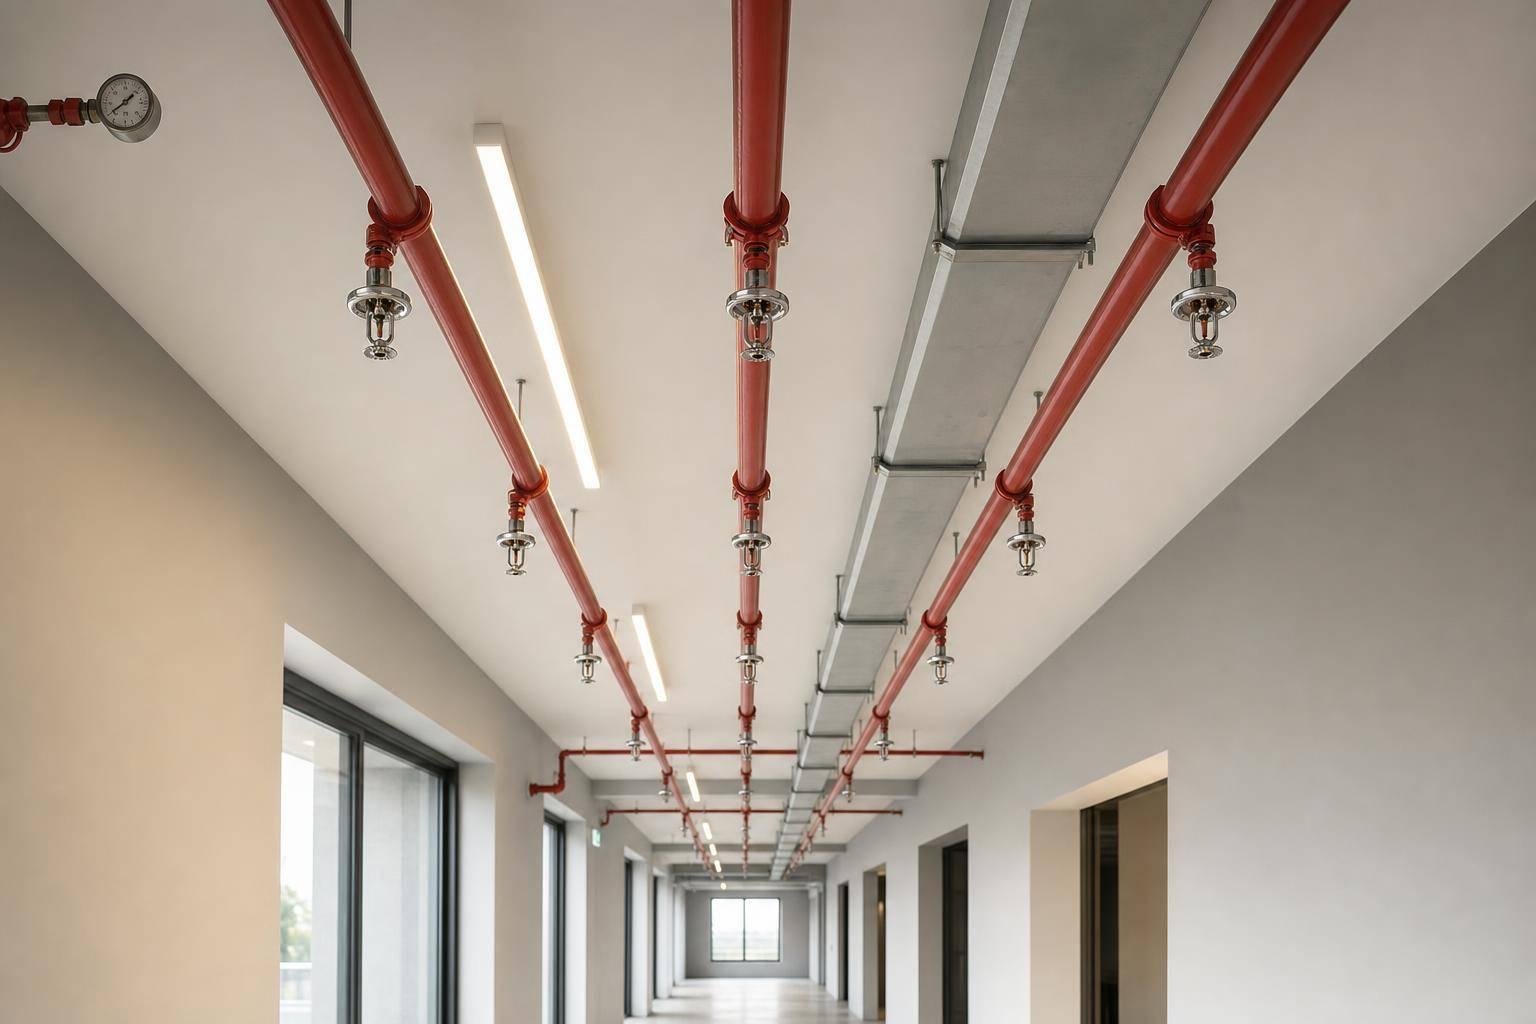
| Cooling Systems | 15–25% |
| Structure & Envelope | 10–15% |
| Site & Civil | 8–12% |
| Fire & Safety | 5–10% |
| Network & Connectivity | 5–8% |
One expense that often surprises owners is utility interconnection. Depending on how far your site is from existing grid capacity, this line item alone can range from $5 million to $25 million or more [1].
On top of these core components, factors like redundancy and advanced cooling systems can drive costs even higher.
Beyond the basics, certain design choices, especially for redundancy and cooling, have a big impact on the budget. For example, moving from a Tier II to a Tier III facility increases costs by 15–25%, while building a Tier IV data center - requiring full 2N+1 redundancy - can cost 25–40% more than a Tier III design [1]. For AI-focused projects, mechanical, electrical, and plumbing (MEP) systems now make up around 75% of the Guaranteed Maximum Price (GMP) [3].
Cooling systems are another major cost driver, especially for AI workloads. Traditional air cooling systems can handle up to 25 kW per rack, but AI infrastructure often demands 30–80+ kW per rack. This shift requires advanced solutions like direct-to-chip or immersion cooling, which can add $2,000–$5,000 or more per rack [1]. For a 500-rack AI hall, that’s an additional $1M–$2.5M - and that’s before factoring in the necessary electrical upgrades.
Keeping an eye on emerging cost pressures is critical for staying on budget in 2026. Rising material costs, including steel and aluminum tariffs, higher copper prices, and a 23% increase in land prices for parcels over 50 acres, are all pushing budgets higher [1].
Another challenge is equipment lead times. Medium-voltage switchgear now has a 22-month lead time, while high-capacity transformers take 18 months [3]. Globally, the average lead time for critical components is 33 months [7]. To avoid delays, owners should start procurement 18–22 months before construction begins.
"The jump from $7M/MW in 2020 to $11M–$20M/MW in 2026 isn't one cost driver. It's four: electrical density, liquid cooling, redundant power trains, and automated functional testing." - Archdesk [3]
Labor shortages in skilled MEP trades are adding to the pressure. Gaps in commissioning and BIM coordination are directly affecting costs and schedules, particularly in major U.S. markets [7].
Where you build has a direct impact on construction costs. Depending on the location, your overall expenses can vary by as much as 25–40% [1].
Some areas of the country are noticeably pricier than others. The Northeast, West Coast, and Virginia/Mid-Atlantic corridor rank among the most expensive. For instance, Northern Virginia, known for its dense concentration of data centers, sees construction costs ranging from $800 to $1,100+ per square foot. This is due to high land prices, elevated labor costs, and significant grid congestion. The Northeast and West Coast push costs even higher, with ranges from $900 to $1,200+ per square foot, driven by union labor and complex permitting requirements [1].
On the more budget-friendly side, Texas and the Southeast typically range from $600 to $900 and $600 to $850 per square foot, respectively. The Midwest sits in the middle, costing around $650 to $950 per square foot, while the Mountain West averages $700 to $1,000 per square foot. The Mountain West benefits from cooler temperatures, which can reduce mechanical cooling demands and lower operating costs [1].
For more on how power infrastructure affects site selection and project timelines, check out the power and energy infrastructure guide.
These regional differences reflect the various factors shaping construction costs across the country.
Interestingly, equipment costs - like those for transformers, switchgear, and UPS systems - are consistent across regions. As Christopher Brown, Partner and Head of Strategy at KPMG, explains:
"Regional cost variance is driven primarily by construction dynamics, rather than equipment pricing." [4]
The main drivers of cost differences include local labor rates, how construction teams prepare for complex projects, and regulatory hurdles. High-cost markets often mean higher wages for trade labor, more competition for subcontractors, and stricter permitting requirements. Power availability also plays a big role. For example, Northern Virginia faces 4–6 year grid interconnection delays and power rates of $0.095–$0.13 per kWh, an 18% increase from the previous year. Compare that to Phoenix/Mesa, where rates are $0.058–$0.078 per kWh and wait times are just 8–14 months [9].
"Gone are the days when power strategy was an operational consideration layered onto site selection. It now is site selection." - Matt Vincent, Editor in Chief, Data Center Frontier [5]
This shift in priorities is driving investment toward Tier-2 markets like Columbus (served by AEP Ohio), Salt Lake City, and San Antonio (served by CPS Energy) [8].
Understanding these factors is critical for aligning your project budget with local conditions.
To account for regional cost drivers, start with the national benchmark of $8–$12 million per MW (or $960 per square foot) [1]. Then adjust based on the location:
| Region | Cost Per Square Foot |
|---|---|
| Northeast / West Coast | $900–$1,200+ |
| Virginia / Mid-Atlantic | $800–$1,100+ |
| Mountain West | $700–$1,000 |
| Midwest | $650–$950 |
| Southeast | $600–$850 |
| Texas | $600–$900 |
Don’t stop at initial construction costs - factor in long-term operational expenses, which make up 62–68% of a facility’s 15-year total cost of ownership [4][9]. For instance, while building in Northern Virginia might seem manageable, higher electricity and labor costs could make it significantly more expensive to run over time compared to a site in Phoenix or San Antonio. Always evaluate the full lifecycle costs before finalizing your decision.
Building on regional cost insights, here are some strategies to help trim budgets and keep schedules on track. These proven methods can significantly lower your per-MW costs.
The biggest savings often happen before construction even begins. For instance, opting for a brownfield site can reduce costs by 10–15%, bringing per-MW expenses down to $7M–$8M compared to $8M–$12M for greenfield projects [10].
Another effective approach is modular and prefabricated construction. By using prefabricated components like electrical rooms, cooling skids, and building shells, you can cut on-site labor needs and shorten project timelines by up to 44%. This method also speeds up installation by 30–40% [3][1].
Early procurement is equally important. Key equipment like switchgear and UPS systems often have lead times of 26–52 weeks [1][11]. Ordering these long-lead items during the design phase ensures they don’t delay the project. Additionally, using a GMP (Guaranteed Maximum Price) contract with experienced contractors helps lock in costs and avoid price escalation [1]. For more details on how delivery models impact outcomes, check out the data center construction guide.
Lastly, right-sizing your redundancy tier can lead to big savings. If your uptime needs don’t require full 2N+1 redundancy, building to Tier IV could leave you with unused capacity - essentially paying for infrastructure you won’t use.
These strategies help streamline your project, setting the stage for smoother execution and reduced risks.
The construction team you choose can make or break your budget. For example, delays on a 60MW facility can cost up to $14.2 million per month [3]. This highlights how critical it is to have the right people managing your project.
Mechanical, electrical, and plumbing (MEP) coordination is often where the most risk lies. These systems can account for up to 75% of the GMP in AI-focused builds [3]. Contractors without strong MEP experience are more likely to cause costly change orders or overlook integration issues that surface late in the process - when fixes are most expensive. As one industry analysis explains:
"Choosing proven data center contractors helps control the costs of data center construction by reducing rework and improving schedule certainty." – Element Homes [2]
Commissioning is another critical phase. Failures during Integrated Systems Testing (IST) - often tied to earlier coordination problems - can delay a project by an average of 3.8 months [3]. Working with teams that have a track record of commissioning success is a smart way to safeguard your budget.
Also, using non-local crews can lead to a 15–20% drop in initial productivity [3]. Factoring this into your upfront bid can help avoid unpleasant surprises later.
Securing skilled project teams is a vital step in keeping costs and schedules under control.
Finding the right talent for mission-critical projects is no small task. Roles like project managers, MEP coordinators, commissioning leads, cost estimators, and schedulers require specialized expertise, and the talent pool for these positions is both limited and highly sought after.
That’s where iRecruit.co comes in. Founded by Dallas Bond and Tanya Runholt, the firm focuses on recruiting for mission-critical sectors like data centers, energy, and advanced manufacturing. Their approach emphasizes pre-qualified candidate screening, ensuring that only candidates with the right technical skills and project experience are presented to owners and contractors. They also offer a 90-day search credit for replacements, minimizing the financial risk of hiring the wrong person on a time-sensitive project.
For owners working with tight deadlines and fixed budgets, this level of hiring certainty can be a game-changer for project success.
MW-based pricing has become a reliable method for aligning costs with operational capacity. Current benchmarks show that standard facilities cost between $8 million and $12 million per MW, while AI-optimized facilities can cost up to 100% more than this range [1]. This means the cost per square foot for AI-ready facilities could be 50–100% higher compared to conventional builds [1].
Electrical and power systems remain the largest single expense, accounting for 40–50% of total construction costs. Regional factors can also make a big difference, with location alone influencing costs by 25–40%. Additionally, upgrading from Tier III to Tier IV redundancy could add another 15–25% to your budget [1]. These variables are key to keeping your project on track financially or risking unexpected overruns.
These benchmarks provide the foundation for the following actionable strategies.
To effectively manage your budget while meeting operational goals, consider these strategies:
As Matt Vincent, Editor in Chief of Data Center Frontier, aptly stated:
"Success in this cycle will hinge less on chasing demand and more on mastering the mechanics of delivery at unprecedented scale." [5]
This underscores the importance of assembling a strong team, having a solid procurement strategy, and ensuring skilled management from the very beginning of your project.
The $/MW benchmarks usually do not account for expenses like land acquisition, interconnection requests, or early design costs. These are typically addressed prior to the start of the construction budgeting phase.
To estimate $/MW, you need to account for how rack density and the type of cooling system influence costs. Facilities with higher rack densities, particularly those optimized for AI workloads, often rely on advanced cooling solutions like liquid cooling. This can significantly drive up expenses. Generally, costs fall between $7 million and $12 million per MW, but higher densities and more intricate cooling setups can push these numbers even further.
Delays in acquiring long-lead electrical equipment, like transformers, can throw a wrench in project timelines. To stay ahead, consider proactive measures such as early procurement and modular construction.
By purchasing critical components early, you can sidestep potential delays caused by lengthy manufacturing and delivery times. Modular construction techniques also help streamline the process, as prefabricated components can be assembled more efficiently on-site.
Another smart move? Choose project locations with dependable power infrastructure. And don’t underestimate the importance of early coordination with suppliers - building these relationships early can ensure timely delivery and reduce unnecessary risks. Together, these strategies can help keep your project running smoothly and on schedule.