Lean scheduling is transforming how high-stakes projects like data centers and energy facilities are managed. By focusing on real-time planning, collaboration, and waste reduction, lean methods help teams achieve higher task reliability and avoid costly delays. Key metrics like Planned Percent Complete (PPC), Cycle Time, and Milestone Variance ensure that projects stay on track, while tools like the Last Planner System and pull-based planning improve coordination and efficiency.
Why it matters:
Lean scheduling combines structured planning with real-world execution, ensuring mission-critical projects meet deadlines and budgets. The right talent and tools are essential for success.
Push vs Pull Planning in Lean Construction Scheduling
For mission-critical projects, where every second counts, lean scheduling is a game-changer. Unlike traditional construction planning, lean scheduling organizes projects into five distinct layers: Master, Phase/Pull, Look-ahead, Weekly Work, and Production Tracking. This layered structure transforms static schedules into dynamic tools for managing progress in real time. When delays can’t be tolerated, this approach is invaluable.
Traditional construction planning is notoriously inefficient - only 18.6% of project time adds value, while the remaining 81.4% is spent on non-productive activities. For projects like data center construction or energy facilities, such inefficiency isn’t just inconvenient; it’s costly. Lean scheduling focuses on cutting out waste and prioritizing tasks that drive progress.
"Lean construction scheduling can complement rather than compete with traditional scheduling processes."
- Rick Bell, Content Strategist, Oracle
By adopting this approach, lean projects achieve impressive results: three times higher on-time completion rates and twice the likelihood of staying under budget compared to traditional methods. Additionally, 84% of contractors report better construction quality, and 77% see boosts in both productivity and safety when using lean principles.
A major focus of lean scheduling is the elimination of waste, which is categorized into eight types, summed up by the acronym DOWNTIME: Defects, Overproduction, Waiting, Non-utilized talent, Transportation, Inventory, Motion, and Extra Processing.
"The most dangerous kind of waste is the waste we do not recognize."
- Shigeo Shingo, Industrial Engineer
The benefits of waste elimination are clear. Take the Denver Federal Center project, for example. During a plumbing overhaul across eight buildings, the team chose to recycle materials rather than discard them. This decision saved $37,125 and kept 319 semi-truckloads of waste out of landfills.
Lean scheduling also emphasizes the "just-in-time" delivery of labor, equipment, and materials (LEM). This reduces idle time and avoids the inefficiencies of stockpiling resources on-site. The process begins with look-ahead planning, where potential bottlenecks - like delayed permits or unready equipment - are identified and resolved before they disrupt progress. The Last Planner System empowers field teams to create realistic workflows based on current conditions, ensuring smoother execution.
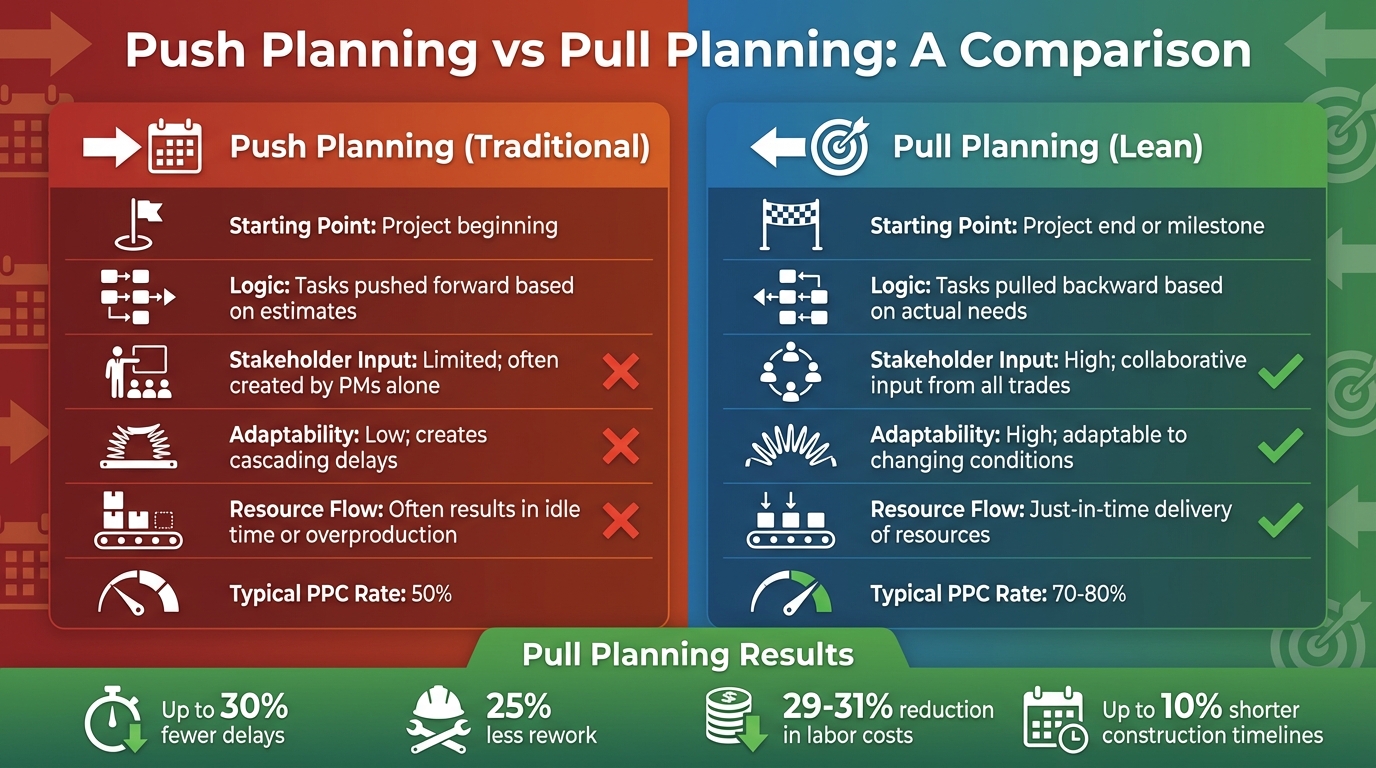
Once waste is minimized, pull-based planning takes center stage. In contrast to traditional "push" scheduling - which assigns tasks based on fixed start dates regardless of conditions - pull planning starts with the end goal. Whether it’s a commissioning milestone or a go-live date, the process works backward to determine the sequence of tasks required to meet that objective.
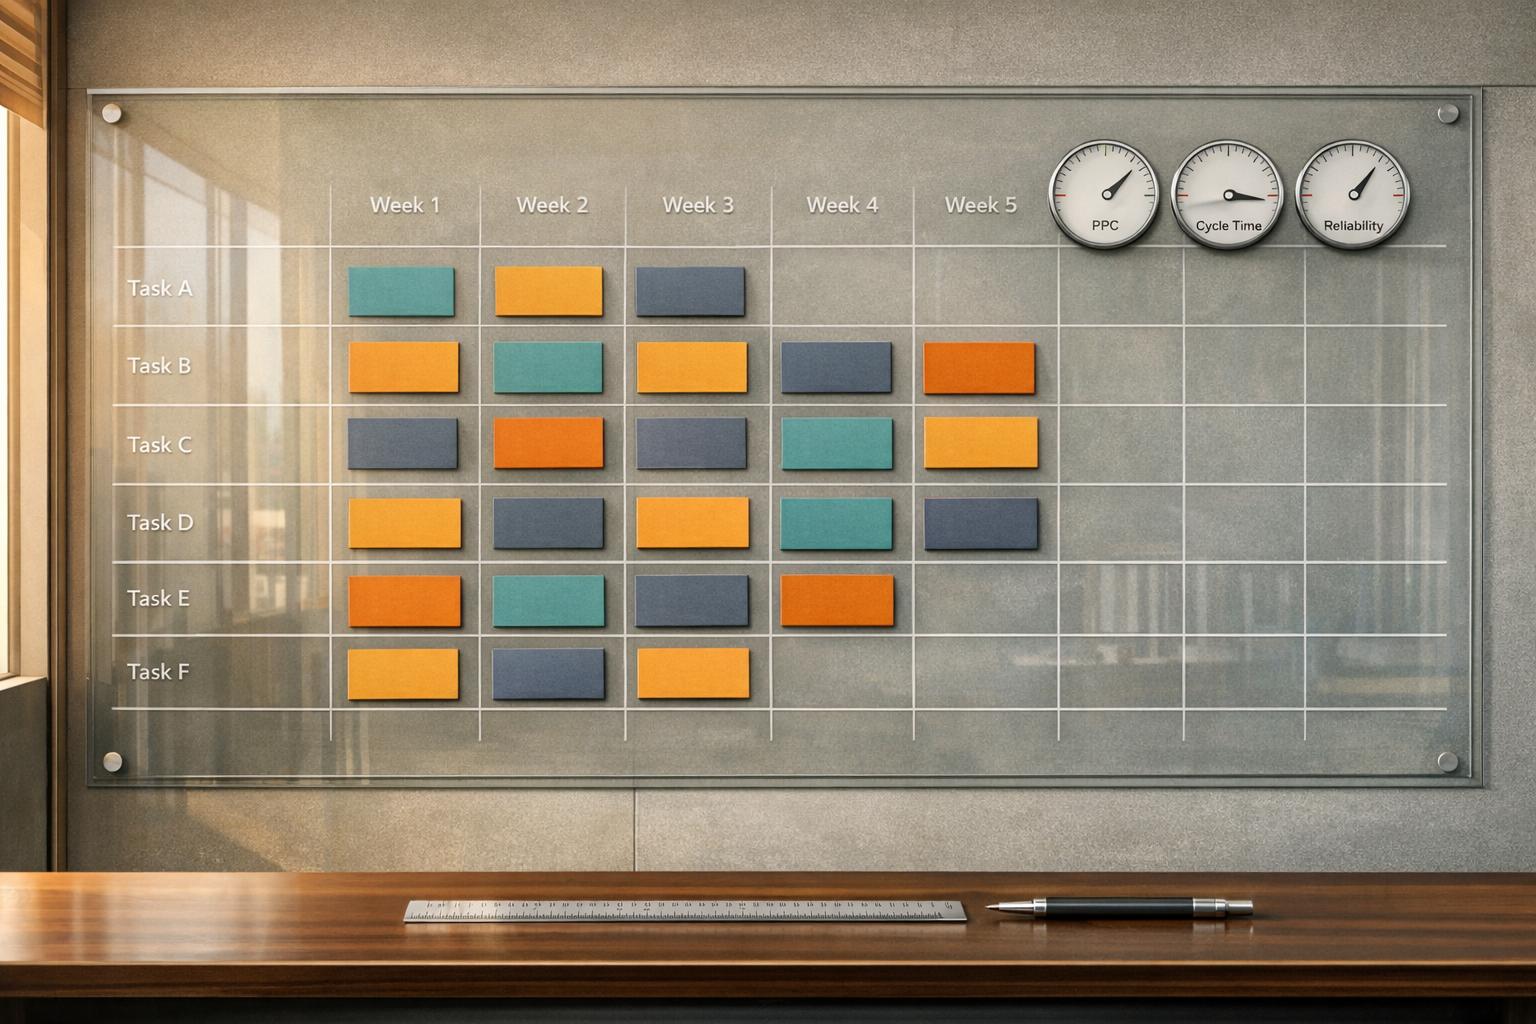
Pull planning sessions are highly collaborative. Representatives from all trades gather to map out the project timeline, often using color-coded sticky notes or digital boards. Starting from the final milestone, they identify what needs to happen immediately before it, then work backward step by step. This ensures tasks are only initiated when the preceding work is complete.
The results are striking. Projects using pull planning experience up to 30% fewer delays and 25% less rework, while labor costs drop by 29–31%. Overall construction timelines can shrink by up to 10%. For industries like data centers, where delays translate to lost revenue, these improvements are game-changing.
Continuous flow builds on pull planning by eliminating the stop-start disruptions common in traditional workflows. The goal is to ensure that as one trade finishes, the next is ready to begin immediately. This requires precise coordination through short-interval execution windows, typically managed with weekly work plans. These plans allow teams to reassess dependencies and adapt to changing circumstances in real time.
| Feature | Push Planning (Traditional) | Pull Planning (Lean) |
|---|---|---|
| Starting Point | Project beginning | Project end or milestone |
| Logic | Tasks pushed forward based on estimates | Tasks pulled backward based on actual needs |
| Stakeholder Input | Limited; often created by PMs alone | High; collaborative input from all trades |
| Adaptability | Low; creates cascading delays | High; adaptable to changing conditions |
| Resource Flow | Often results in idle time or overproduction | Just-in-time delivery of resources |
Pull-based planning is especially critical for projects with tight commissioning windows or ongoing operations, such as occupied facilities. It transforms scheduling from a rigid set of instructions into a collaborative system of commitments. This shift fosters accountability and ensures every participant understands their role in meeting shared goals. Lean projects often achieve Percent Plan Complete (PPC) rates of 70–80%, far surpassing the 50% typical of traditional methods.
Once waste elimination and pull planning are in place, it's time to measure how well your lean scheduling is working. These metrics go beyond just tracking completed tasks - they focus on reliability, flow, and predictability, which are critical for projects where delays can come with hefty costs. By choosing the right metrics, you can pinpoint issues early and manage projects more effectively.
Some key metrics include Planned Percent Complete (PPC), cycle time, lead time, Work in Progress (WIP), and throughput. Together, they provide a clear picture of how your scheduling is performing and help prevent small issues from snowballing into bigger problems. PPC, in particular, offers immediate insight into how reliably teams are meeting their commitments.
"Are we doing what we said we would? is a primary measurement, also called planned percent complete (PPC)."
- Rick Bell, Content Strategist, Oracle
PPC is a cornerstone of lean scheduling. It measures how well teams stick to their weekly commitments. Calculating PPC is straightforward: divide the number of completed tasks by the number of planned tasks, then multiply by 100. For example, if 16 out of 20 tasks are completed, your PPC is 80%.
Tracking PPC weekly helps uncover coordination problems, resource gaps, or overly ambitious planning. While lean projects often achieve PPC rates of 70–80%, traditionally scheduled projects can struggle to hit even 50%. This difference highlights how lean scheduling improves predictability.
PPC also reveals trends over time. For example, in data center construction, where mechanical, electrical, and plumbing (MEP) coordination is crucial, tracking PPC by trade can help identify recurring issues.
Cycle time and lead time are two metrics that, when compared, can highlight delays. Lead time measures the total duration from task creation to completion, while cycle time focuses on the active work phase.
If lead time significantly exceeds cycle time, it usually means tasks are sitting idle in the backlog. For instance, installing electrical panels might take three days of active work (cycle time) but span two weeks overall (lead time) due to delays like waiting for permits or materials. Lean scheduling uses these insights to ensure prerequisites are ready before work begins, helping to keep projects on track.
Milestone Variance (MV) shows how far ahead or behind a project is compared to critical milestones. For mission-critical projects, where certain milestones like inspections or commissioning dates have no room for delays, MV is essential. It's typically calculated as the difference between Earned Value (EV) and Planned Value (PV), expressed in dollar terms.
Work in Progress (WIP) tracks the number of tasks currently underway. Managing WIP effectively is crucial: too many tasks can overwhelm teams, while too few might mean resources are underutilized. A healthy WIP level often corresponds to a resource utilization rate of 70–85%. Tools like Cumulative Flow Diagrams make it easier to monitor WIP and spot bottlenecks before they cause delays.
Commitment Level (CL) measures how reliably "Last Planners" (foremen, superintendents, and trade leads) deliver on their commitments during weekly planning. High CL builds trust among teams and fosters accountability.
Throughput, on the other hand, tracks how many tasks are completed within a specific timeframe, such as a week. For example, if a team completes 15 tasks weekly, that becomes their baseline. A sudden drop in throughput could indicate resource shortages or rework issues. Knowing your team's average throughput helps with accurate forecasting, allowing managers to predict how long the remaining work will take. If throughput isn't enough to meet deadlines, adjustments can be made before it's too late.
| Metric | What It Measures | Why It Matters |
|---|---|---|
| PPC | Reliability of weekly commitments | Improves trade coordination and workflow predictability |
| Cycle Time | Duration of active work | Identifies production bottlenecks during execution |
| WIP | Volume of ongoing tasks | Prevents team overload and minimizes downtime between trades |
| Throughput | Tasks completed per week | Supports accurate forecasting and effective resource allocation |
Implementing lean scheduling bridges the gap between planning metrics and real-world results. This is especially critical for high-stakes projects like data centers and energy facilities, where delays can lead to massive financial losses. The right tools and practices help teams stay aligned and meet deadlines.
The Last Planner System (LPS) is a cornerstone of lean scheduling. Unlike traditional approaches, LPS shifts planning responsibilities from office schedulers to the people directly involved in the work - foremen, superintendents, and trade leads. This ensures plans are practical and reflect on-the-ground realities. LPS operates through five planning levels, ranging from master planning to daily huddles and variance analysis. A standout feature of LPS is pull planning, which ensures tasks are only initiated when necessary, helping to minimize waste and avoid bottlenecks.
"The goal of LPS is not only to complete more of the weekly schedule's task list, but to ensure that each week's work is providing value to the end product."
Make-ready planning, which spans three to six weeks, plays a proactive role in removing obstacles. Teams use a formal constraint log to track and address issues like permits, material deliveries, or design conflicts. Daily huddles and make-ready planning work together to clear these roadblocks and align tasks over a short-term horizon.
For projects involving repetitive tasks, such as those in data centers or pharmaceutical facilities, Takt planning introduces a steady production rhythm. By dividing the project into zones and assigning trades to move sequentially through these areas at regular intervals (the Takt time), this method avoids overcrowding and ensures predictable progress. It also includes capacity buffers to handle unexpected variability.
Once a clear and collaborative planning structure is in place, visual management tools help streamline communication and execution.
Building on strong planning systems, visual management tools make project status instantly accessible to all team members. Visual management turns abstract data into something tangible and actionable. Physical and digital boards prominently display schedules, workflows, and key metrics like Percent Plan Complete (PPC), giving everyone a clear view of the project's progress. Traditional pull planning often takes place in "Big Rooms", where stakeholders use sticky notes on walls to collaborate face-to-face.
Digital tools have expanded this concept. Cloud-based platforms now bring project information directly to mobile devices, enabling crews to check schedules, report updates, and flag issues in real time. For example, Oracle Primavera Cloud integrates digital sticky notes with master CPM schedules, creating a seamless link between strategic planning and field-level execution. Similarly, Specter Automation connects Last Planner tasks to 3D models, reportedly saving users about an hour daily by automating look-ahead planning and documentation.
"The software becomes the communication tool rather than the unmovable note wall."
- Rick Bell, Content Strategist, Oracle
Visual dashboards simplify communication further by using intuitive signals - like red, yellow, and green traffic lights - to indicate performance and flag issues without requiring specialized knowledge. Tools like Hoylu provide adaptive digital workspaces that emulate physical pull-planning walls while automatically calculating performance metrics. Outbuild offers real-time PPC analytics and generates weekly plans automatically, while InTakt focuses on Takt planning with automated CPM logic and zone mapping.
In modern mission-critical projects, teams often combine the Critical Path Method (CPM) for tracking contractual milestones with lean scheduling for daily field operations. However, no tool can replace a solid lean process. Technology is there to support the system, not to substitute for it.
These tools and practices work together to ensure mission-critical projects stay on track and within budget.
Lean scheduling thrives on constant refinement, particularly in high-stakes projects like data centers and energy facilities, where even minor delays can lead to massive financial losses. Teams that excel in these environments leverage feedback loops to turn obstacles into learning opportunities, building on lean principles to improve task reliability and consistently deliver value.
The Plan-Do-Check-Act (PDCA) cycle offers a clear, repeatable structure for improving lean scheduling practices over time. Here’s how it works:
"PDCA, short for plan, do, check, and act, is a simple and effective approach for monitoring a construction project's progress, adjusting to problems, and looking for ways to improve."
- Rick Bell, Content Strategist, Oracle
This cycle isn’t a one-time exercise - it’s applied daily, weekly, and monthly to tackle immediate field issues while also addressing long-term goals. When tasks fall behind, techniques like the "5 Whys" are used to dig into the root causes. Within the Last Planner System, the learning phase specifically focuses on uncovering why certain tasks weren’t completed as planned. This process helps teams eliminate recurring obstacles before they disrupt future workflows.
Once PDCA insights are gathered, benchmarking provides an additional layer of guidance for improving performance. By comparing against industry standards and historical data, teams establish baselines to measure progress. Weekly PPC tracking reveals how individual trade partners perform throughout the project. For complex projects, monitoring "near-critical paths" - tasks with minimal float (less than 5% to 10% of total project duration) - helps identify bottlenecks that could jeopardize the master schedule.
Advanced Earned Value Management (EVM) tools, like Earned Schedule (ES) and the To-Complete Performance Index (TCPI), offer deeper insights into future performance than traditional metrics. Digital dashboards further enhance this process by providing real-time comparisons between actual production and look-ahead plans. Regularly recalculating the critical path after status updates or when significant risks arise ensures benchmarks remain accurate and actionable.
"PPC reinforces continuous improvement as an outcome to maximize both project and customer value."
- Rick Bell, Content Strategist, Oracle
Lean scheduling isn't just about technical tools or methodologies - it thrives on the expertise of skilled professionals. Without the right talent, even the most advanced lean metrics can fall short. Success depends on individuals who bring technical scheduling expertise and a deep understanding of sector-specific needs, such as MEP systems, commissioning sequences, and controls integration. These elements often define the critical path for projects like data centers and energy facilities.
However, there's a significant talent shortage. Only about 20–30% of construction professionals have lean methodology expertise. Meanwhile, demand for these specialists keeps growing as data center and industrial projects expand across the country. The ideal candidates often have 5–10 years of construction management experience, certifications like PMP or Lean Construction Institute credentials, and a proven ability to cut schedule waste by 20–30%.
"In mission-critical construction, workforce availability is no longer a downstream consideration. It is a primary factor in whether projects stay on schedule, maintain quality, and achieve operational readiness."
One key differentiator for top performers is pattern recognition. Experienced professionals who've worked on similar projects can spot potential delays before they snowball into major issues. This skill can't be learned overnight. For example, a $500M data center project that employed lean-certified schedulers saw PPC improve from 60% to 92%, cycle times drop by 25%, and the project delivered two months ahead of schedule - avoiding $10M in penalties.
iRecruit.co specializes in connecting companies with the talent needed for these high-stakes roles, including project managers, schedulers, cost estimators, and MEP/commissioning experts with lean construction experience. Their approach streamlines hiring by 40–50%, leveraging talent mapping and technical screening to ensure candidates have hands-on experience with tools like Primavera P6 and metrics like Milestone Variance. With success-based pricing and a 90-day placement guarantee, they help organizations secure critical hires before construction mobilization - when strong leadership is vital to project success. Finding the right talent is essential for maintaining lean scheduling performance throughout every stage of a project.
This guide has highlighted how lean scheduling plays a crucial role in achieving precision and reducing delays in mission-critical projects. By shifting from traditional Critical Path Method (CPM) forecasting to incorporating metrics like Planned Percent Complete (PPC), Cycle Time, and Milestone Variance, teams gain better adaptability and real-time visibility into project progress. Research indicates that lean-managed project sites significantly outperform traditional scheduling in PPC. This improvement leads to fewer delays, less waste, and more predictable outcomes, especially for complex projects like data centers and energy infrastructure.
The most effective approach blends CPM for long-term forecasting with Lean methods, such as the Last Planner System, for day-to-day execution. This hybrid model provides the strategic oversight needed for large-scale projects while empowering field teams to address challenges as they arise.
"Lean construction scheduling is a journey, not a destination."
- Rick Bell, Content Strategist, Oracle
However, even the most advanced tools and methodologies rely on skilled professionals to deliver results. Success in lean scheduling depends on having a workforce with expertise in areas like MEP systems, commissioning sequences, and collaborative planning. These professionals must not only have experience with similar projects but also the ability to anticipate and mitigate potential issues. Workforce planning has become just as critical as procurement and risk management in ensuring successful project delivery.
iRecruit.co supports mission-critical builders and developers by connecting them with specialized talent, including project managers, schedulers, MEP leaders, and commissioning experts. These professionals bring the lean scheduling knowledge and industry-specific experience necessary to excel in complex projects. With streamlined hiring processes and pre-qualified candidates, iRecruit.co ensures that teams have the leadership they need well before construction begins.
To figure out the Percent Plan Complete (PPC) for a weekly work plan, follow these steps:
For instance, if you planned 10 tasks and successfully completed 8, your PPC would be:
(8 ÷ 10) × 100 = 80%.
This means you achieved 80% of your planned work for the week.
When it comes to commissioning dates, certain metrics play a critical role in keeping projects on track and ensuring systems are ready to perform. These include:
These metrics are designed to ensure systems are reliable, effective, and ready to handle various scenarios, ultimately supporting smooth and timely project delivery.
Teams can blend CPM (Critical Path Method) and the Last Planner System (LPS) through a hybrid scheduling approach. CPM offers a framework for long-term milestones, risk analysis, and project forecasting, while LPS hones in on weekly work plans and dependable execution at the field level. By combining these methods, teams can maintain strategic, high-level oversight while ensuring flexible, on-the-ground planning. This balance is especially valuable for keeping mission-critical projects on track.